AutoGDIS
About
AutoGDIS is a web application for interpreters in the oil & gas industry, comparable to industry solutions ("Sapphire") and Russian ones ("RN-Vega", "RN-Geosim"), but with extended features. Its key advantage is the integration of machine learning and neural databases for geological modeling.
Problem & Goals
Geologists and engineers work with complex well-testing data and analytical models. Existing tools often have outdated interfaces, complex navigation, and inefficient workflows — making analysis slow and confusing, raising the learning curve for new specialists and reducing efficiency for experienced ones.
My contribution
Full-cycle design (research → implementation); design system and guidelines from scratch; user flows and prototypes aligned with product owner and stakeholders; final UI layouts; handoff to developers, QA, product testing; ongoing support and improvements.
Business goals
Build a competitive product vs established solutions; deliver a modern, professional interface for corporate clients; improve usability for adoption by large oil companies; create a scalable architecture for future modules.
User goals
Reduce complexity of analytical workflows; simplify navigation and interaction with complex datasets; improve clarity of data visualization; speed up common interpretation scenarios.
Process
Research & analysis → UX design (flows, sketches, wireframes, scenarios) → Prototyping (stakeholder feedback) → UI design (style, design system, components, screens) → Handoff (specs, dev collaboration) → QA & testing → Product support.
User flow
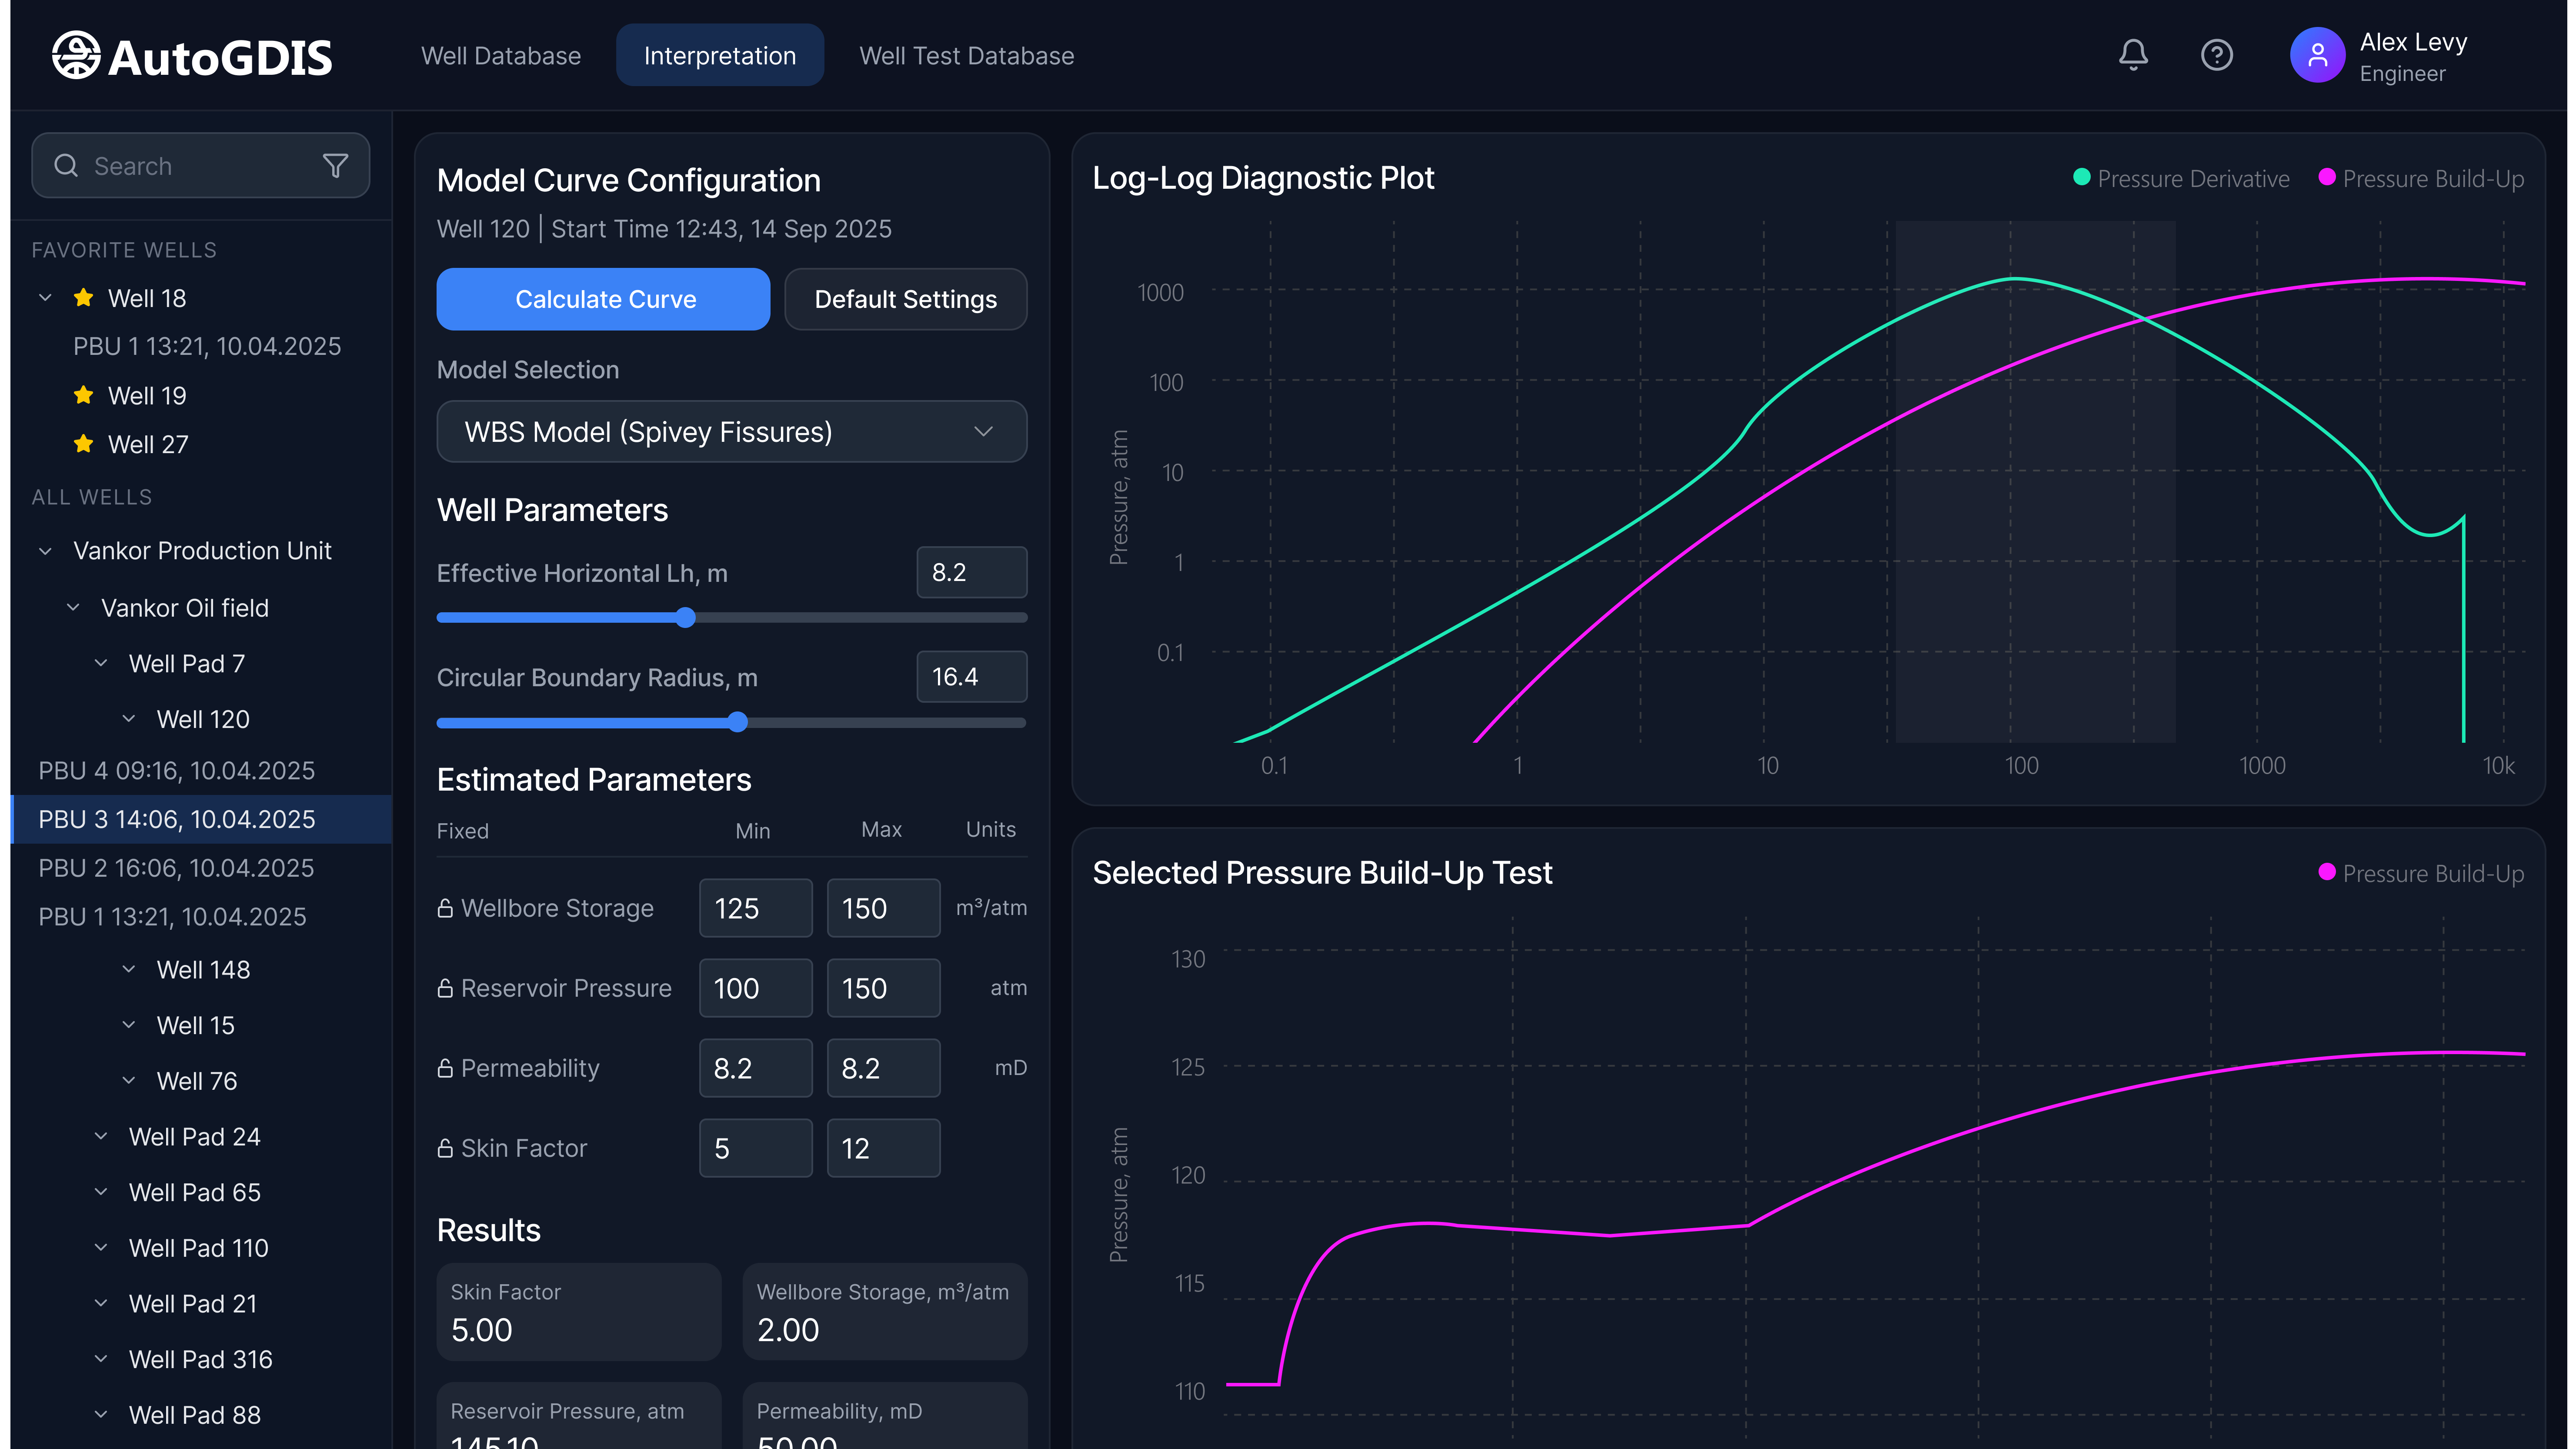
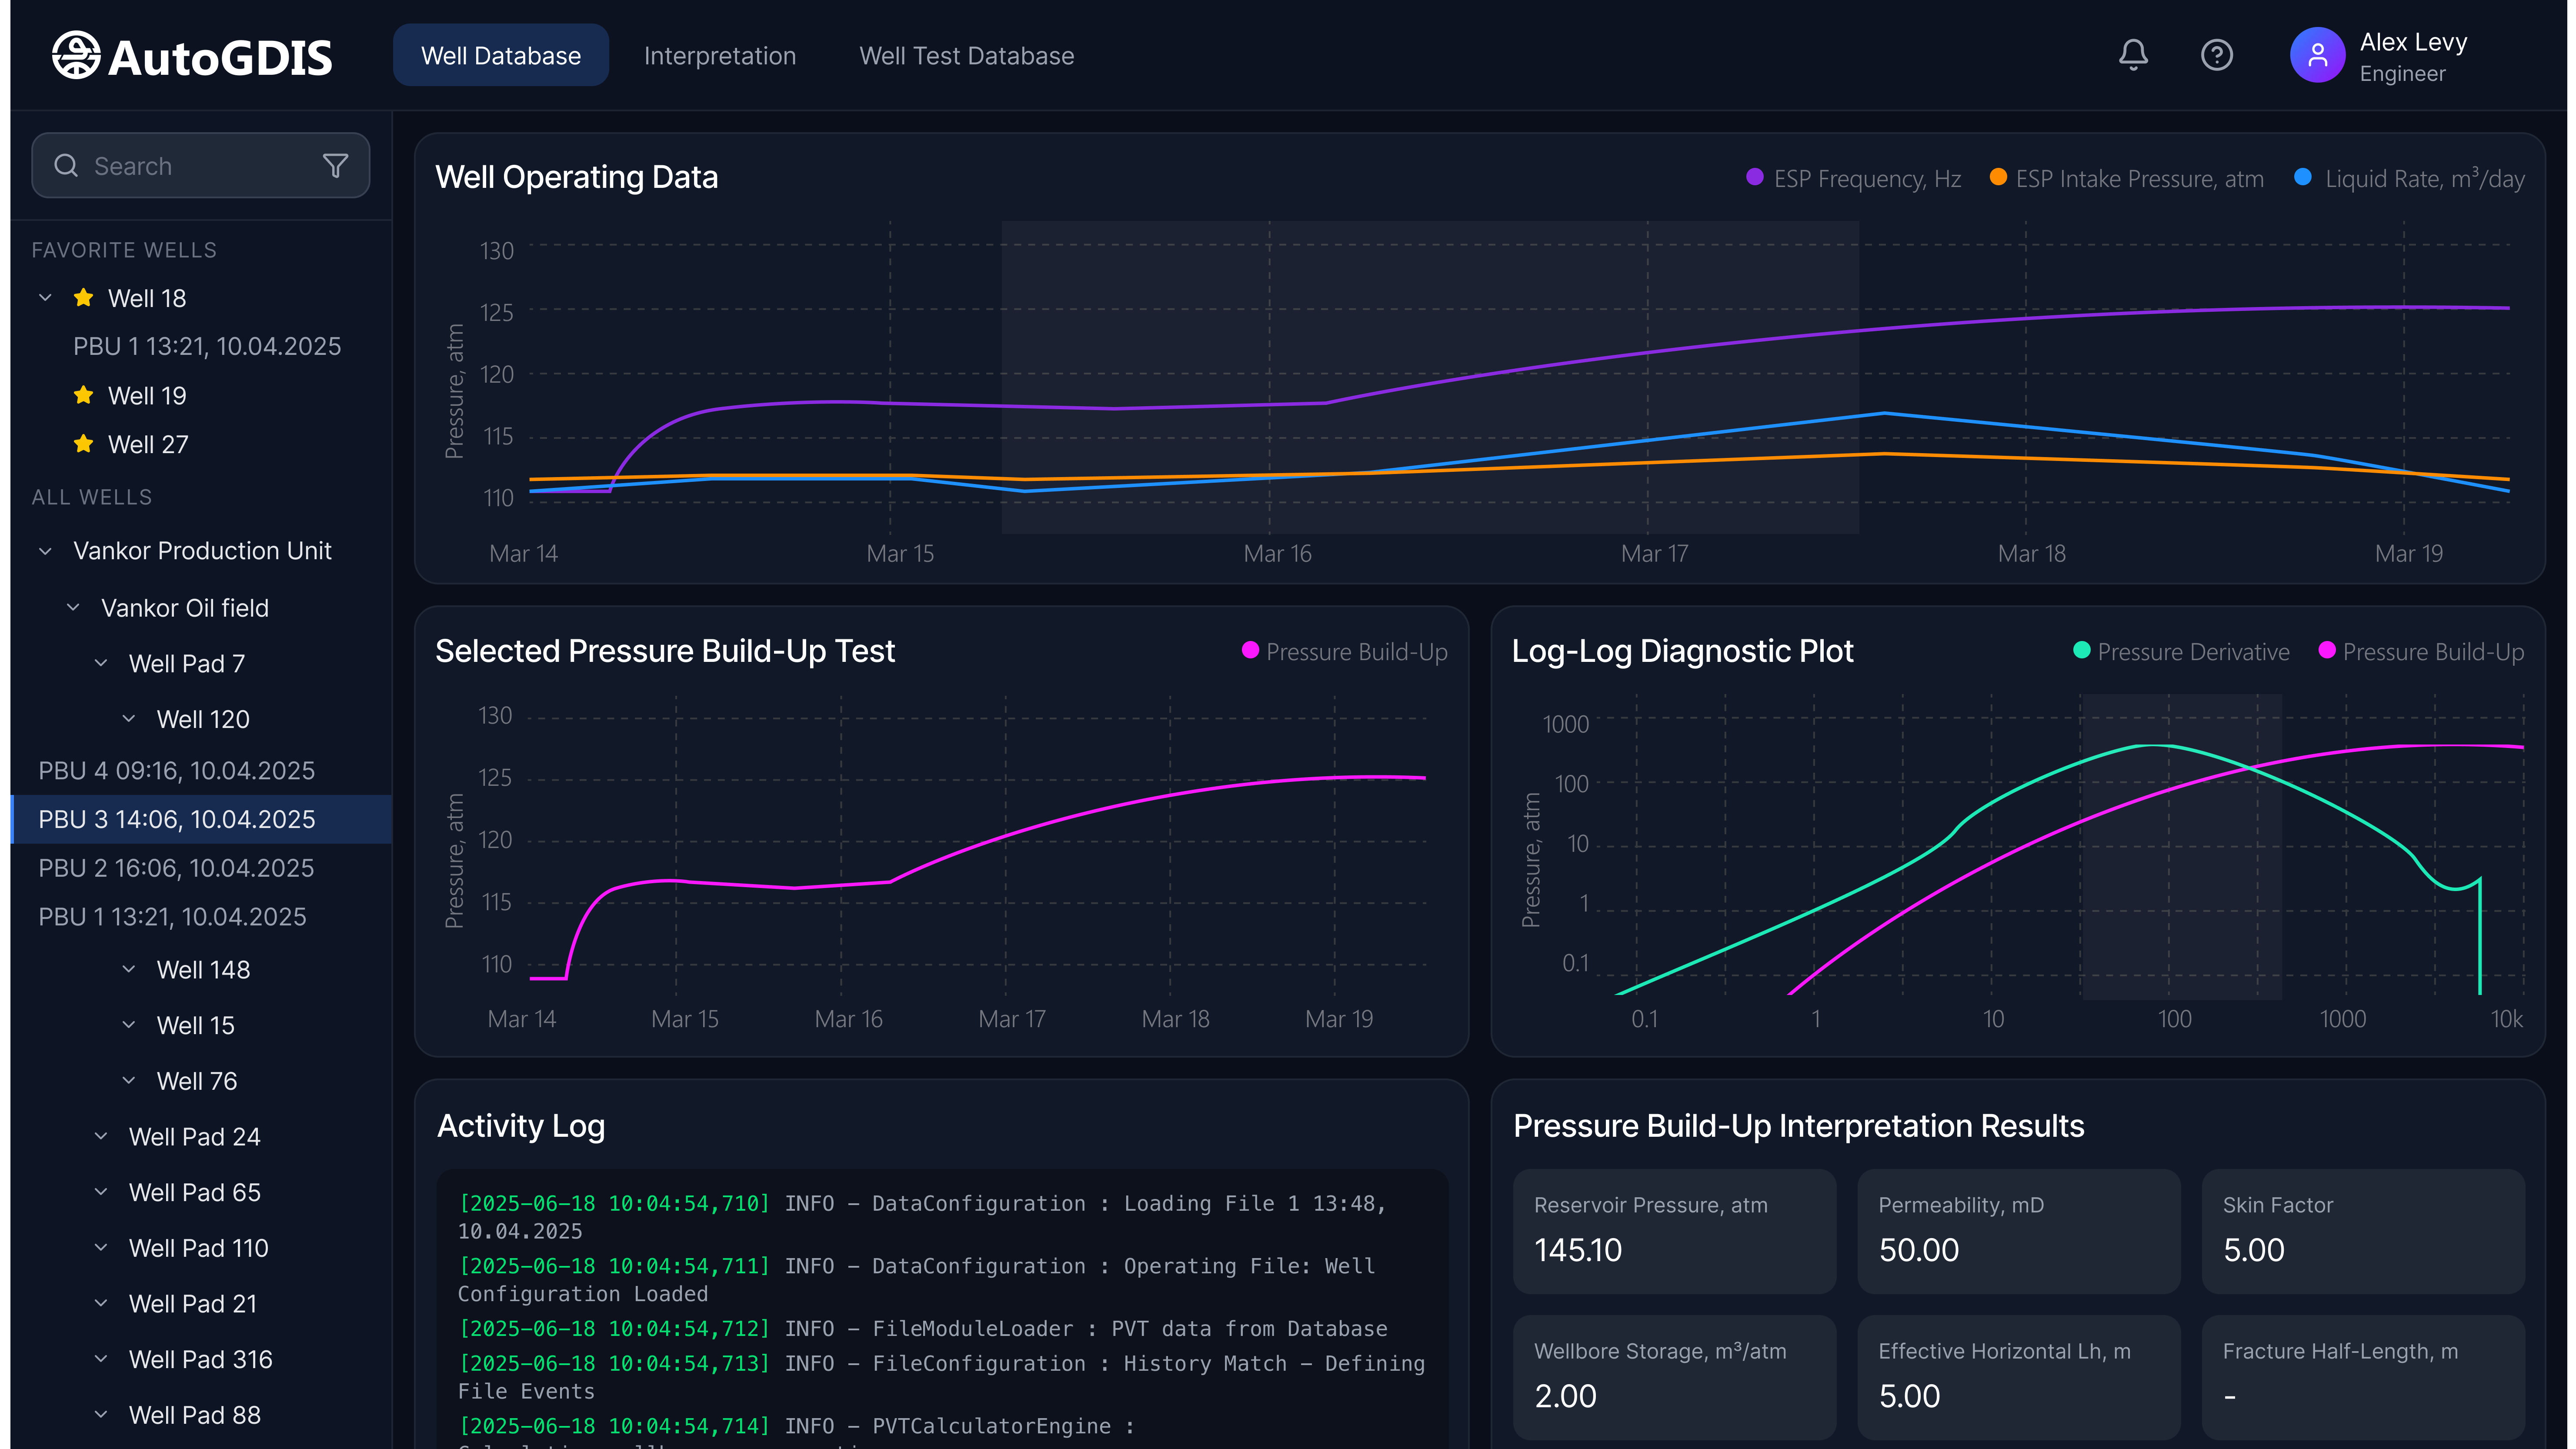
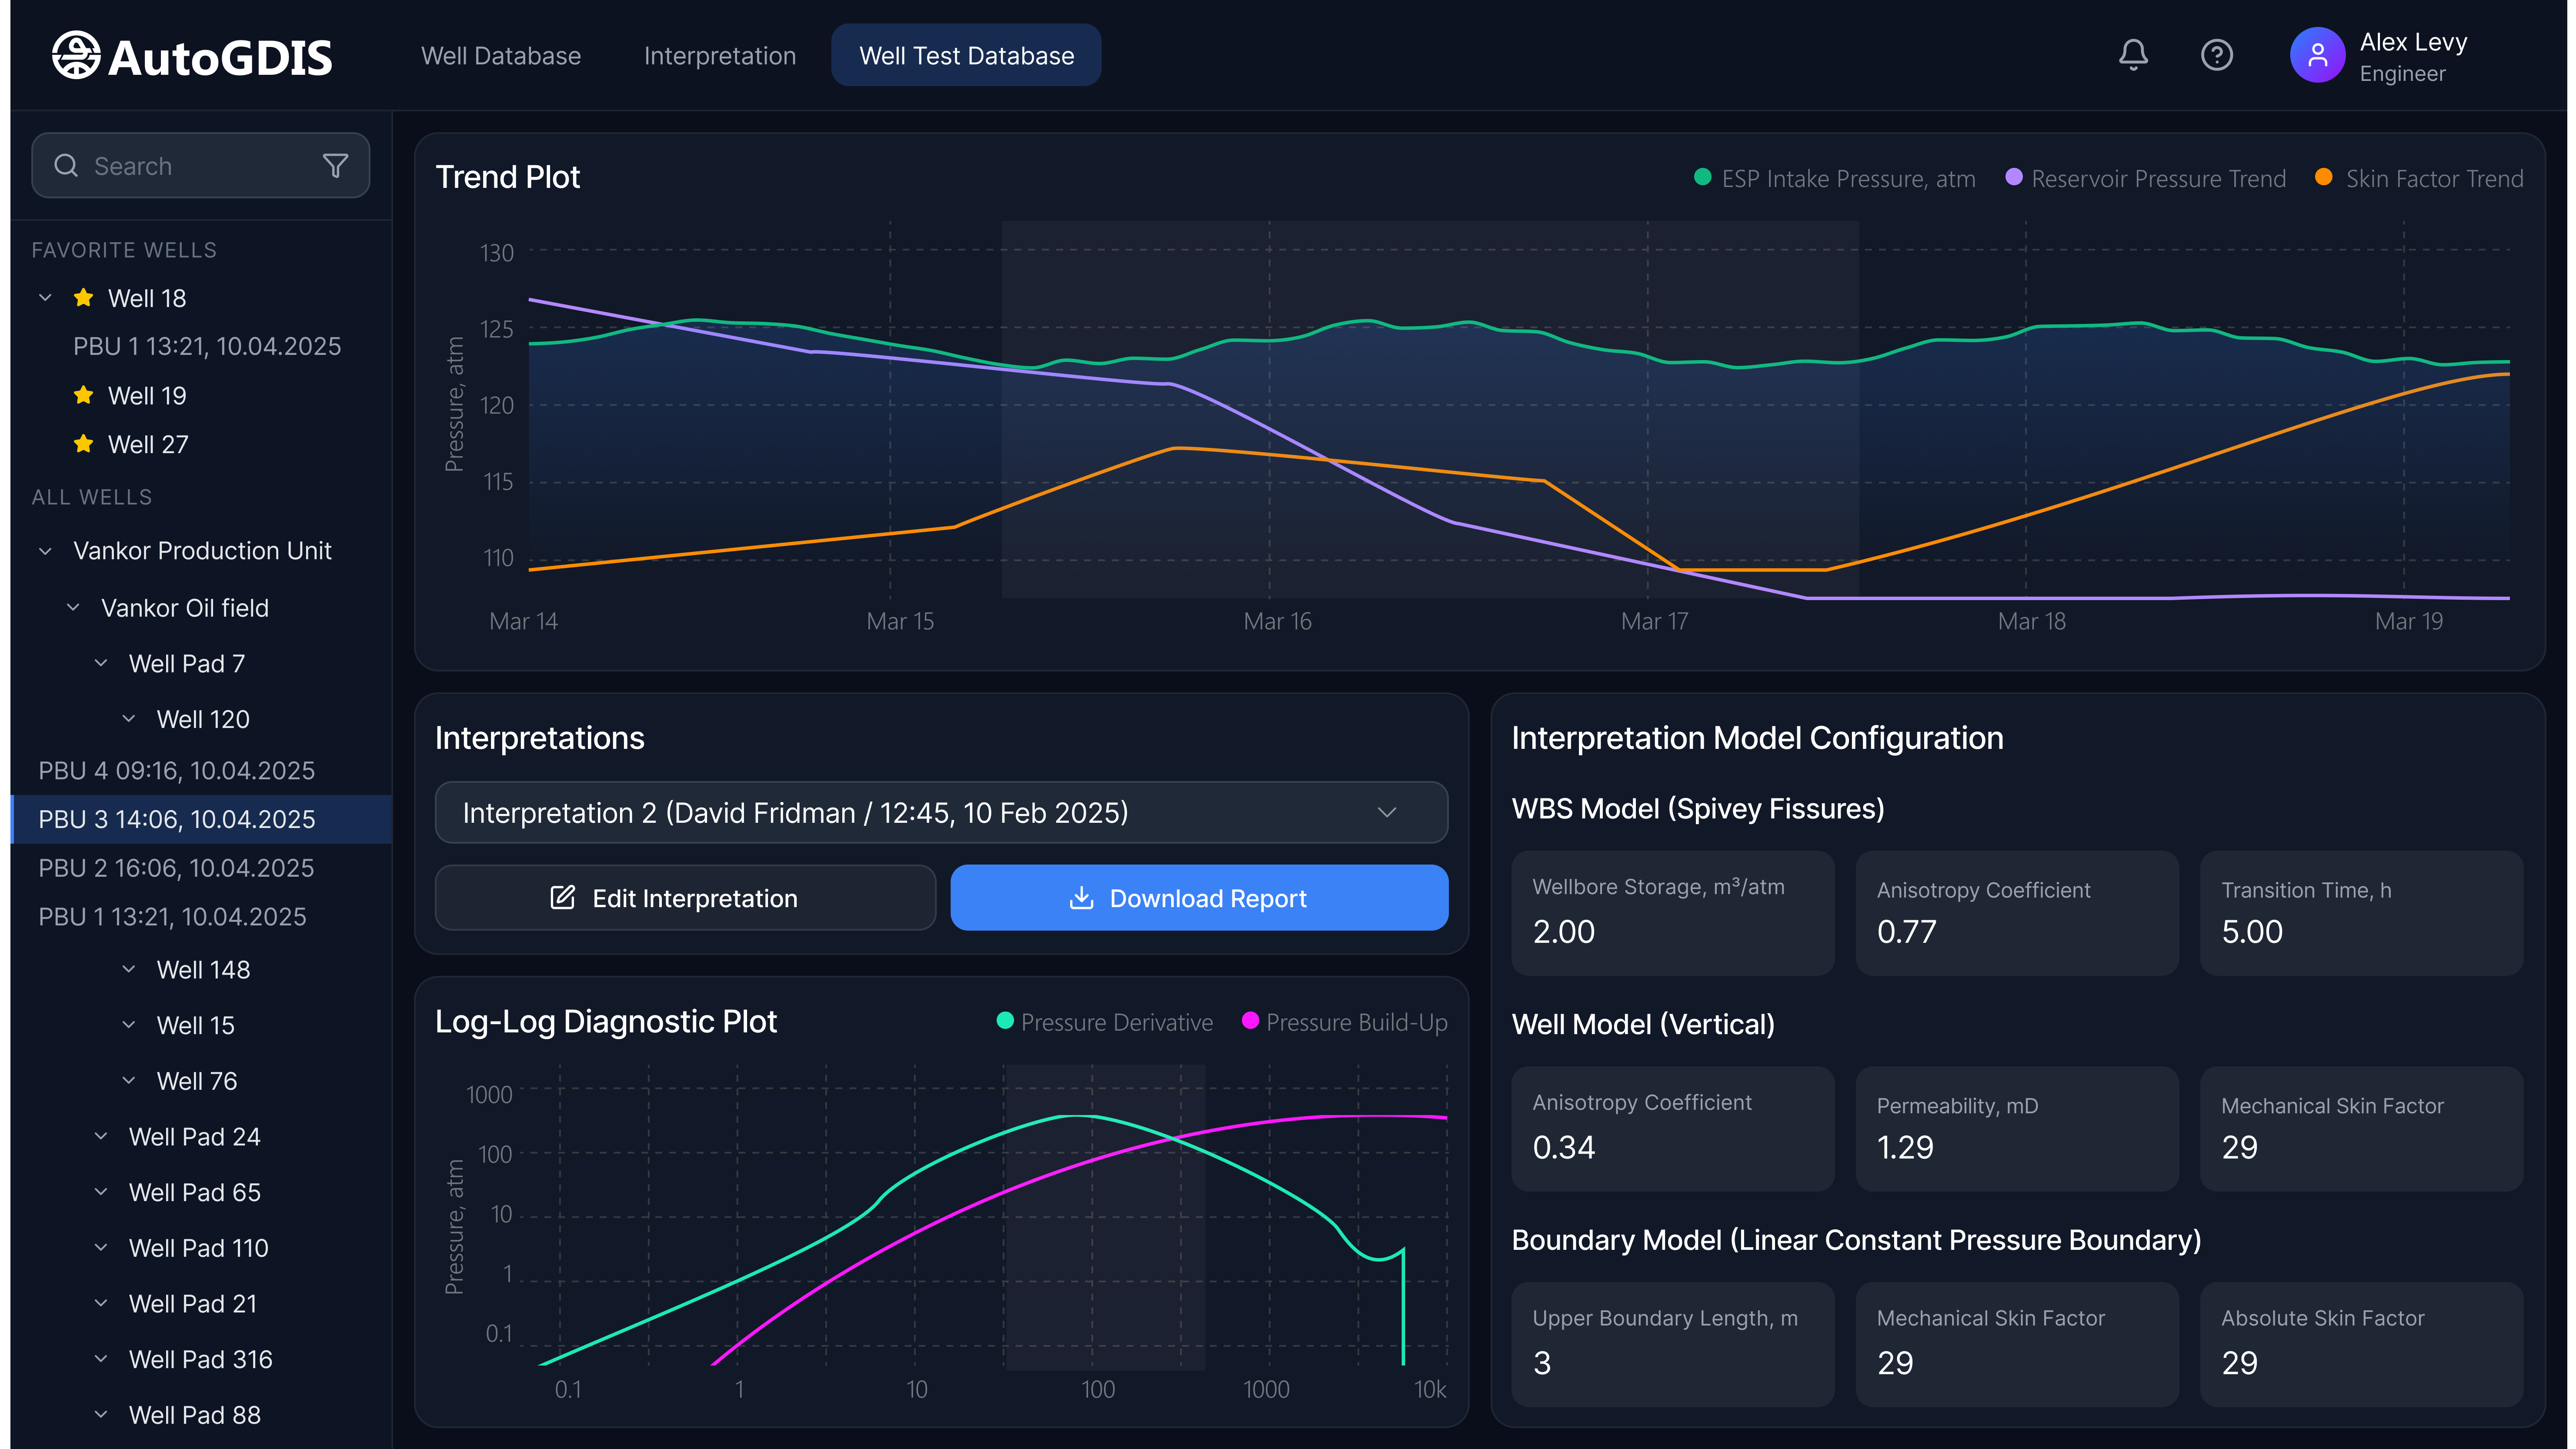
Supports complex workflows for geologists, engineers, analysts, and operators. Typical scenario: load well data → run analysis → verify parameters → generate reports. Reduced from 12 steps across screens to 4 main steps, with advanced configuration still available. Added structured filtering, automatic mode switching, clearer data visualization, simpler work with complex parameters.
Key design decisions
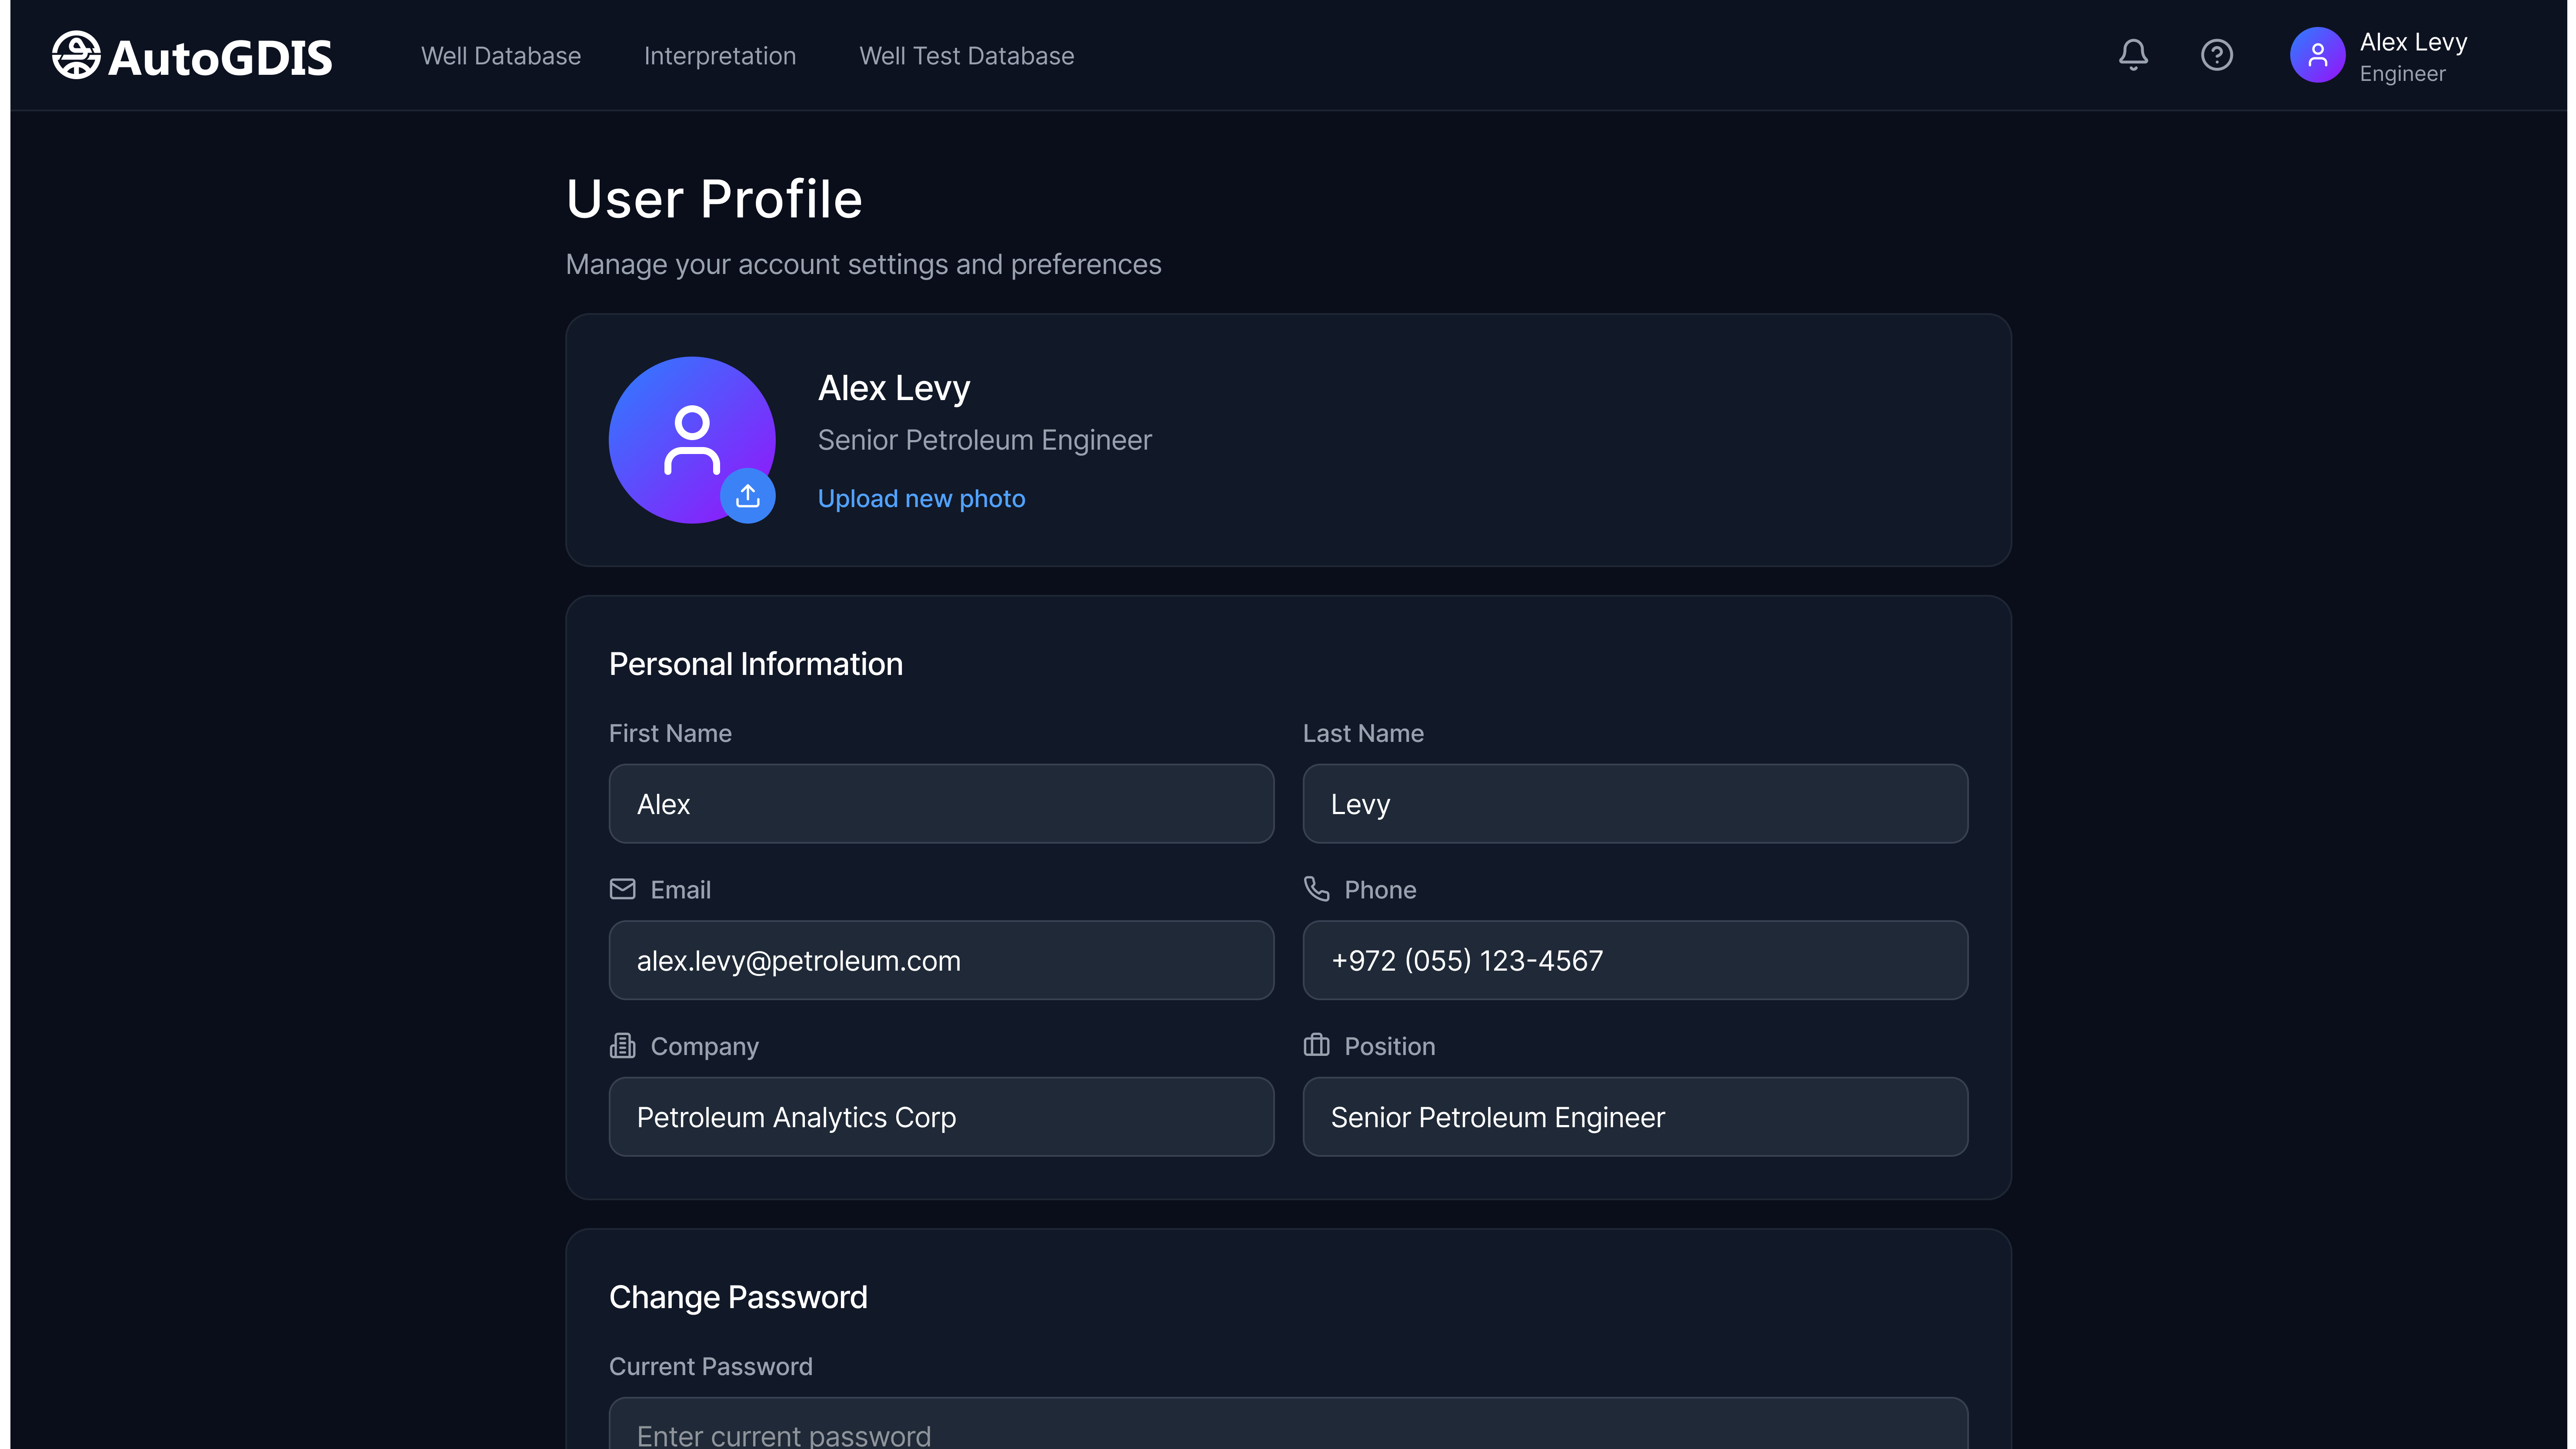
Simplified navigation and fewer steps; step-by-step setup for complex modules (PVT phase setup, model curves); reorganized settings; key parameters and visualizations prioritized in the main workspace; modular UI patterns.
Design trade-offs
More parameters = accuracy but risk of overload; simpler workflows reduce flexibility for advanced users; large visualizations need careful layout; balance data density vs readability; complex config kept accessible without overwhelming the main flow.
Results
Consolidated manual operations and disconnected tools into one system; key processes dropped from ~2 days to ~3 hours; core workflow simplified 12 → 4 steps (~67% less complexity); onboarding cut from ~1 week to 2 days; fewer user errors; launched and adopted by several large oil & gas companies; scalable design system for future modules.
Closing note
This project gave me deep experience leading a complex B2B product from scratch — translating complex domain processes into clear workflows and scalable patterns, and strengthening my expertise in workflow optimization, design systems, and cross-functional collaboration.